Car Insurance Cost by State: Where Is It Cheapest and Priciest?
Car insurance is usually cheapest in Maine and Vermont and priciest in Florida, though the exact ranking changes by driver profile and coverage. A poor fit can add hundreds a year, or leave you short when a claim lands. This guide shows the cheapest and priciest states, how to judge a quote against your state average, and why the gap matters for different drivers.
Cheapest and priciest states compared
The cleanest way to read state premiums is to treat the low end and high end as reference points, not as a promise for every driver. In one 2026 ranking using NAIC data adjusted to 2026 with CPI, Maine sits at $91 per month and Florida at $197 per month, with a national average of $142 per month. That spread is large enough to change whether a quote is fair or overpriced.
What the rankings measure
Do not mix data types. Some rankings use full coverage premiums, while others use the NAIC Auto Insurance Database Report’s average expenditure per insured vehicle. Those figures are related, but they are not the same thing, so a cheap-looking state in one table can look average in another.
Cheapest states at a glance
The cheapest states usually have lower claim frequency, fewer uninsured drivers, and fewer costly injury claims. Maine is the low point at $91 per month in one 2026 full-coverage benchmark. U.S. News also places Vermont at the bottom end, with an average annual premium of $1,347.
Priciest states at a glance
High-cost states often combine dense traffic, storm exposure, more litigation, and insurance rules that push costs into the premium. Florida appears at the top in multiple rankings, including a 2026 figure of $197 per month. That does not make Florida the only expensive state, but it does make it a repeated outlier.
State insurance premium table
This table gives you the two ends of the benchmark and the national average, then turns them into a simple buying signal. Use the monthly figure if your quote is quoted that way. Use the annual figure if you pay in one lump sum or want a cleaner year-to-year comparison.
| State | Monthly premium | Annual premium | Gap vs. $142 national average | One-line shopper takeaway |
|---|---|---|---|---|
| Maine | $91 | $1,097 | -$51/mo; -$607/yr | Strong benchmark for a low-cost state; a quote near this level is broadly in line. |
| Florida | $197 | $2,362 | +$55/mo; +$658/yr | High-cost state; quotes near the average can still be competitive here. |
| Vermont | $128 | $1,347 | -$14/mo; -$357/yr | Below the national monthly average, but not dramatically cheap compared with Maine. |
| Nevada | $335 | Not stated in the supplied source | +$193/mo versus the national average | Very high monthly cost; worth a quote check if your price lands anywhere near this. |
| North Dakota | Not stated in the supplied source | $808 | Annual figure only in the supplied source | Lowest annual figure in the StateCalc ranking; useful as a low-end annual reference. |
| New Hampshire | Not stated in the supplied source | Not stated in the supplied source | Special case | The only state without a required car insurance policy, so comparisons need extra care. |
How to read the table
Use the gap column as a first screen. If your quote is below your state’s average, that is a good sign. If it is far above the average, check whether you are comparing the same coverage level, the same deductible, and the same driver profile. A quote that looks high in Maine may be ordinary in Florida.
Cheapest vs. priciest snapshot
- Maine: $91 per month, $1,097 per year, or $51 below the national monthly average.
- Florida: $197 per month, $2,362 per year, or $55 above the national monthly average.
- Spread: $106 per month between those two figures, before driver-specific pricing.
Why some states cost more
Three forces matter most: no-fault rules, uninsured driver exposure, and claim severity. States with more injury claims, more medical payments, or more uninsured motorists tend to spread higher losses across every insured driver. Add heavy traffic, storm damage, and higher repair bills, and the premium climbs further.
No-fault rules and PIP coverage
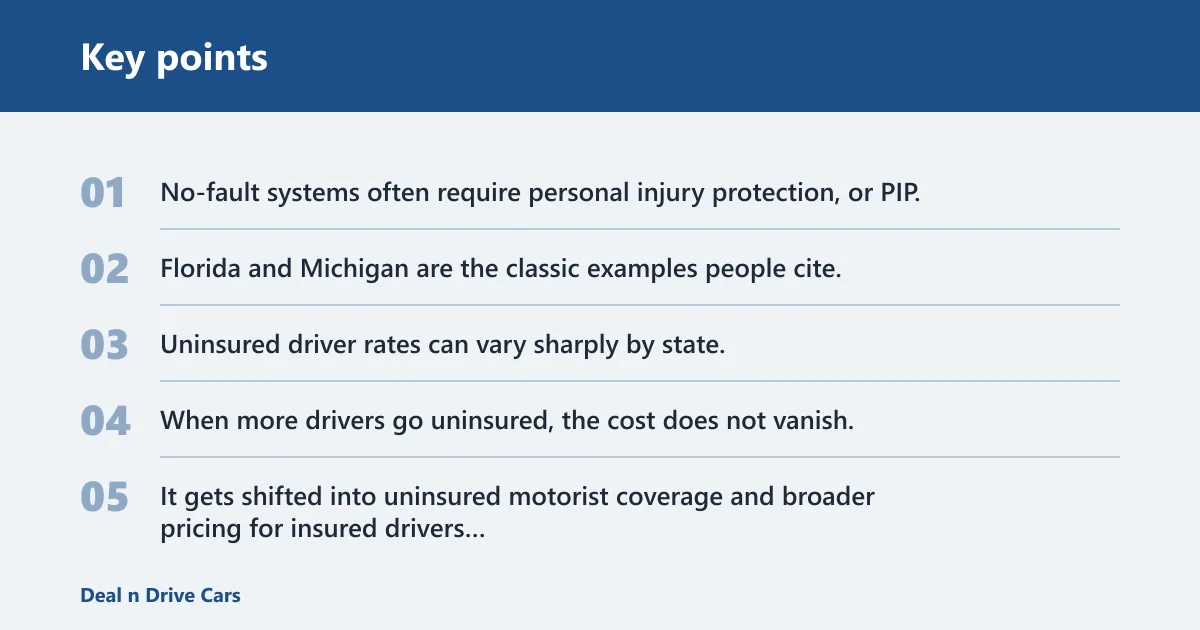
No-fault systems often require personal injury protection, or PIP, and they can raise prices when medical claims and related dispute costs rise. Florida and Michigan are the classic examples people cite, because the structure of injury coverage can push more cost into the premium before liability claims even enter the picture.
Uninsured driver rates
Uninsured driver rates can vary sharply by state, with some estimates putting them at under 5% in some places and over 25% in others. When more drivers go uninsured, the cost does not vanish. It gets shifted into uninsured motorist coverage and broader pricing for insured drivers who have to absorb that risk through the pool.
Weather, traffic, and repair costs
Dense urban traffic means more crashes. Severe weather means more comprehensive claims. More expensive parts and labor mean each repair costs more. Put those together and a state can move from average to expensive even if its laws are not the only issue.
Say your state has heavy storm exposure and a high uninsured driver rate, but your own quote is still close to the state average. That can happen if your vehicle is older, your mileage is low, and your record is clean. The state is still expensive overall, but your profile softens the hit.
Is Florida really the most expensive state for car insurance?
Florida is often the most expensive state in full-coverage rankings, but not every dataset puts it first. The key is to match the source, the coverage type, and the year before you treat any “most expensive” label as final.
Why Florida often ranks high
Florida combines no-fault coverage, heavy claim pressure, and a large share of drivers exposed to injury and uninsured-motorist costs. That mix can push the average well above the national figure. A 2026 estimate of $197 per month is far enough from $142 to matter for almost any shopper.
Where louisiana and Nevada fit
InsuranceMetrics shows Nevada at $335 per month, which is far above Vermont’s $128. That difference is a clean example of how the same driver can face a very different bill just by changing states. Florida may be highest in one table, while another source gives a different top spot.
When different data sources disagree
Disagreement usually comes from the measurement itself. One source may use full coverage, another may use average expenditure per insured vehicle, and another may compare a specific policy profile. A state can be the most expensive in one ranking and only second or third in another without either source being wrong.
How to judge your quote
Start with your state average, then ask whether your quote is above or below that line for the same coverage. A quote that is modestly above the average may still be normal if you have a newer car, higher limits, or a weaker credit tier. A quote that is well below the average is usually worth keeping.
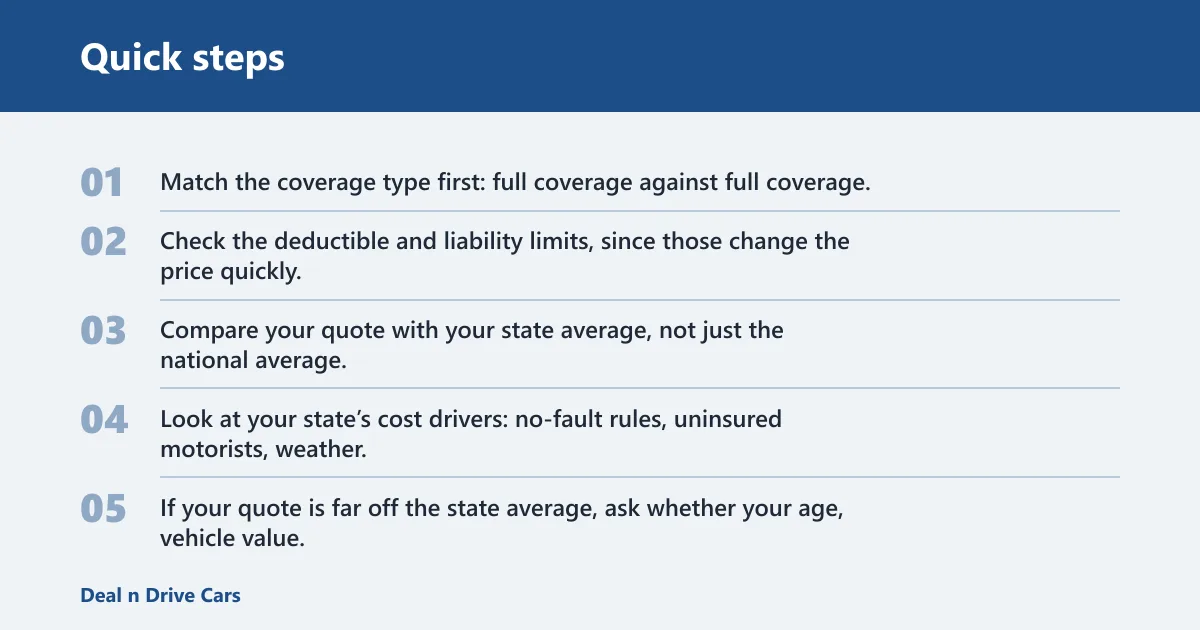
- Match the coverage type first: full coverage against full coverage, or liability against liability.
- Check the deductible and liability limits, since those change the price quickly.
- Compare your quote with your state average, not just the national average.
- Look at your state’s cost drivers: no-fault rules, uninsured motorists, weather, and traffic.
- If your quote is far off the state average, ask whether your age, vehicle value, or credit tier explains the gap.
When full coverage and minimum liability should not be mixed
Full coverage usually costs more than state minimum liability because it pays for more damage. That sounds obvious, but it is where many shoppers get misled. If a chart shows a low minimum-liability average and you are shopping for a financed car, the low number is not the right benchmark.
Picture a driver in Maine with a seven-year-old sedan and a clean record. If the quote is above the state average by a small amount, the vehicle value and chosen limits may explain it. Now picture the same driver in Florida. The same quote could be excellent there and merely average in Maine.
What the national average hides
The $142 monthly national average is useful as a quick anchor, but it hides big state-level differences and even bigger person-level differences. Averages flatten the market. They do not tell you whether your own risk profile sits above or below the typical driver in your state.
Why averages can mislead
A 22-year-old in an expensive city, a 45-year-old in a rural county, and a retiree with an older vehicle will not receive the same quote. The state average blends those cases together. It is a useful benchmark, not a promise.
Why drivers in the same state pay different amounts
Age, credit tier where allowed, mileage, garaging address, vehicle value, and claims history all affect price. That is why one shopper in Florida may pay close to the state average while another pays far more. The state sets the backdrop; the driver sets the final quote.
When a state average is still useful
Use the average to spot outliers. If your quote is wildly above the state average for the same coverage, that is a signal to shop again. If it sits near the average and your limits are stronger than a competitor’s, the price may be fair.
How the numbers were built
The ranking figures in the supplied sources are based on the NAIC Auto Insurance Database Report, and some rankings use full coverage premiums while StateCalc uses average expenditure per insured vehicle.
Why the source label matters
A published annual premium from one site is not identical to another site’s monthly full-coverage quote, even if both are current. Vermont at $1,347 annual and North Dakota at $808 annual come from other source tables. Keep those baselines separate.
What the inflation adjustment means
CPI adjustment brings older premium data into a 2026 dollar value so the numbers can be compared on the same footing. It does not turn every ranking into a live quote. It is a pricing basis, not a guarantee of what any insurer will charge you today.
Frequently asked questions
Which state has the cheapest car insurance?
Maine is cheapest in one 2026 full-coverage ranking at $91 per month, while U.S. News names Vermont as the cheapest state in its own analysis. That difference comes from the source and the method. Always check whether the figure is full coverage, average expenditure, or another policy basis.
Which state has the most expensive car insurance?
Florida is the most expensive state in several of the supplied rankings, including a 2026 figure of $197 per month and a StateCalc annual figure of $1,865. But not every source ranks it first. Louisiana and Nevada can appear near the top in other tables, depending on what the ranking measures.
Why does car insurance cost more in some states than others?
Costs rise where claims are more frequent or more severe. No-fault rules, PIP coverage, uninsured drivers, weather damage, dense traffic, repair costs, and litigation all push premiums up. States with fewer claims and lower repair costs usually sit lower in the rankings.
How much more expensive is car insurance in high-cost states?
That is a $106 monthly spread between the two states, or $1,272 over a year before driver-specific factors are added.
How do I compare my quote to my state average?
Match the coverage first, then compare your quote with your state’s average for the same level of protection. If your quote is above the state average, check deductibles, limits, and your own risk factors. If it is below, that is usually a sign you are getting a competitive price.